ROLE Data visualization, Interaction Design
ROLE Data visualization, Interaction Design
TOOL USED Adobe Illustrator, After Effects
TOOL USED Adobe Illustrator, After Effects
CLIENTS School Project
CLIENTS School Project
Simplicity Pays
Simplicity Pays
Interactive Infographic
Interactive Infographic
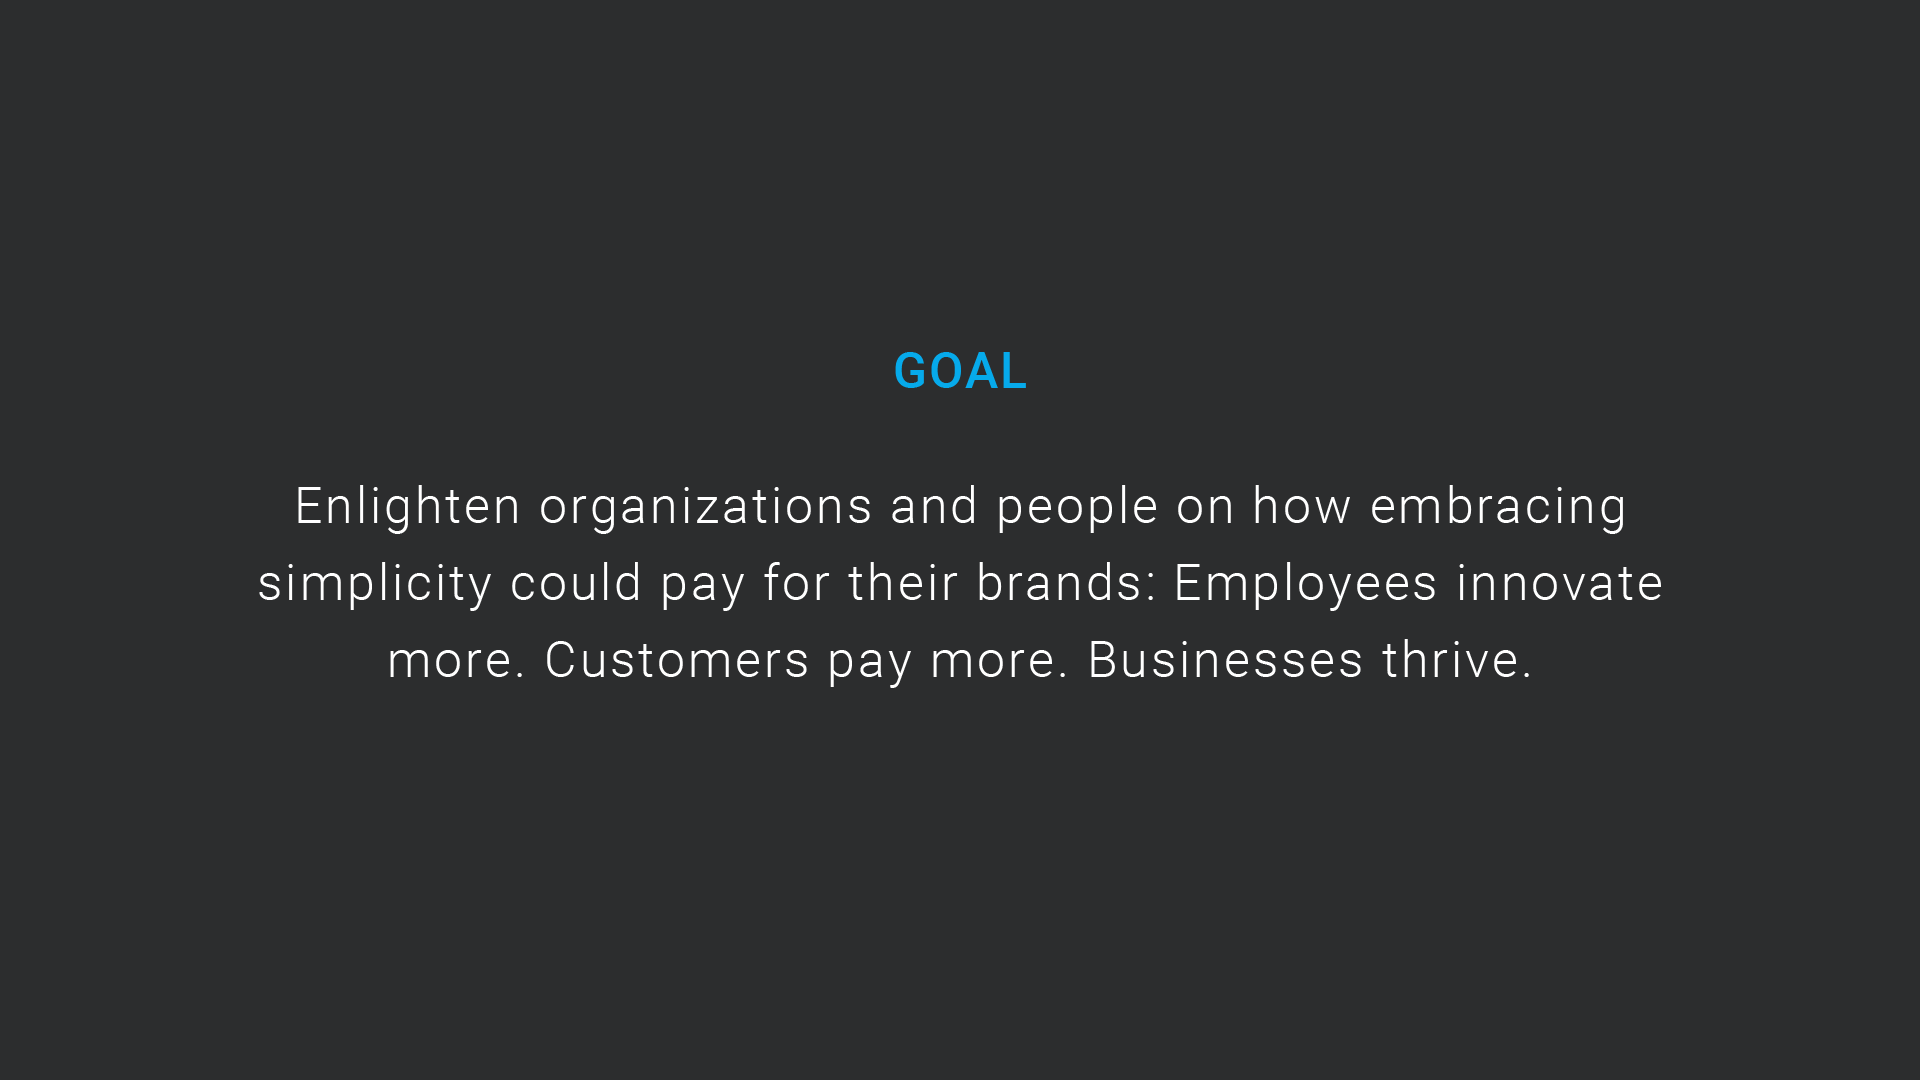
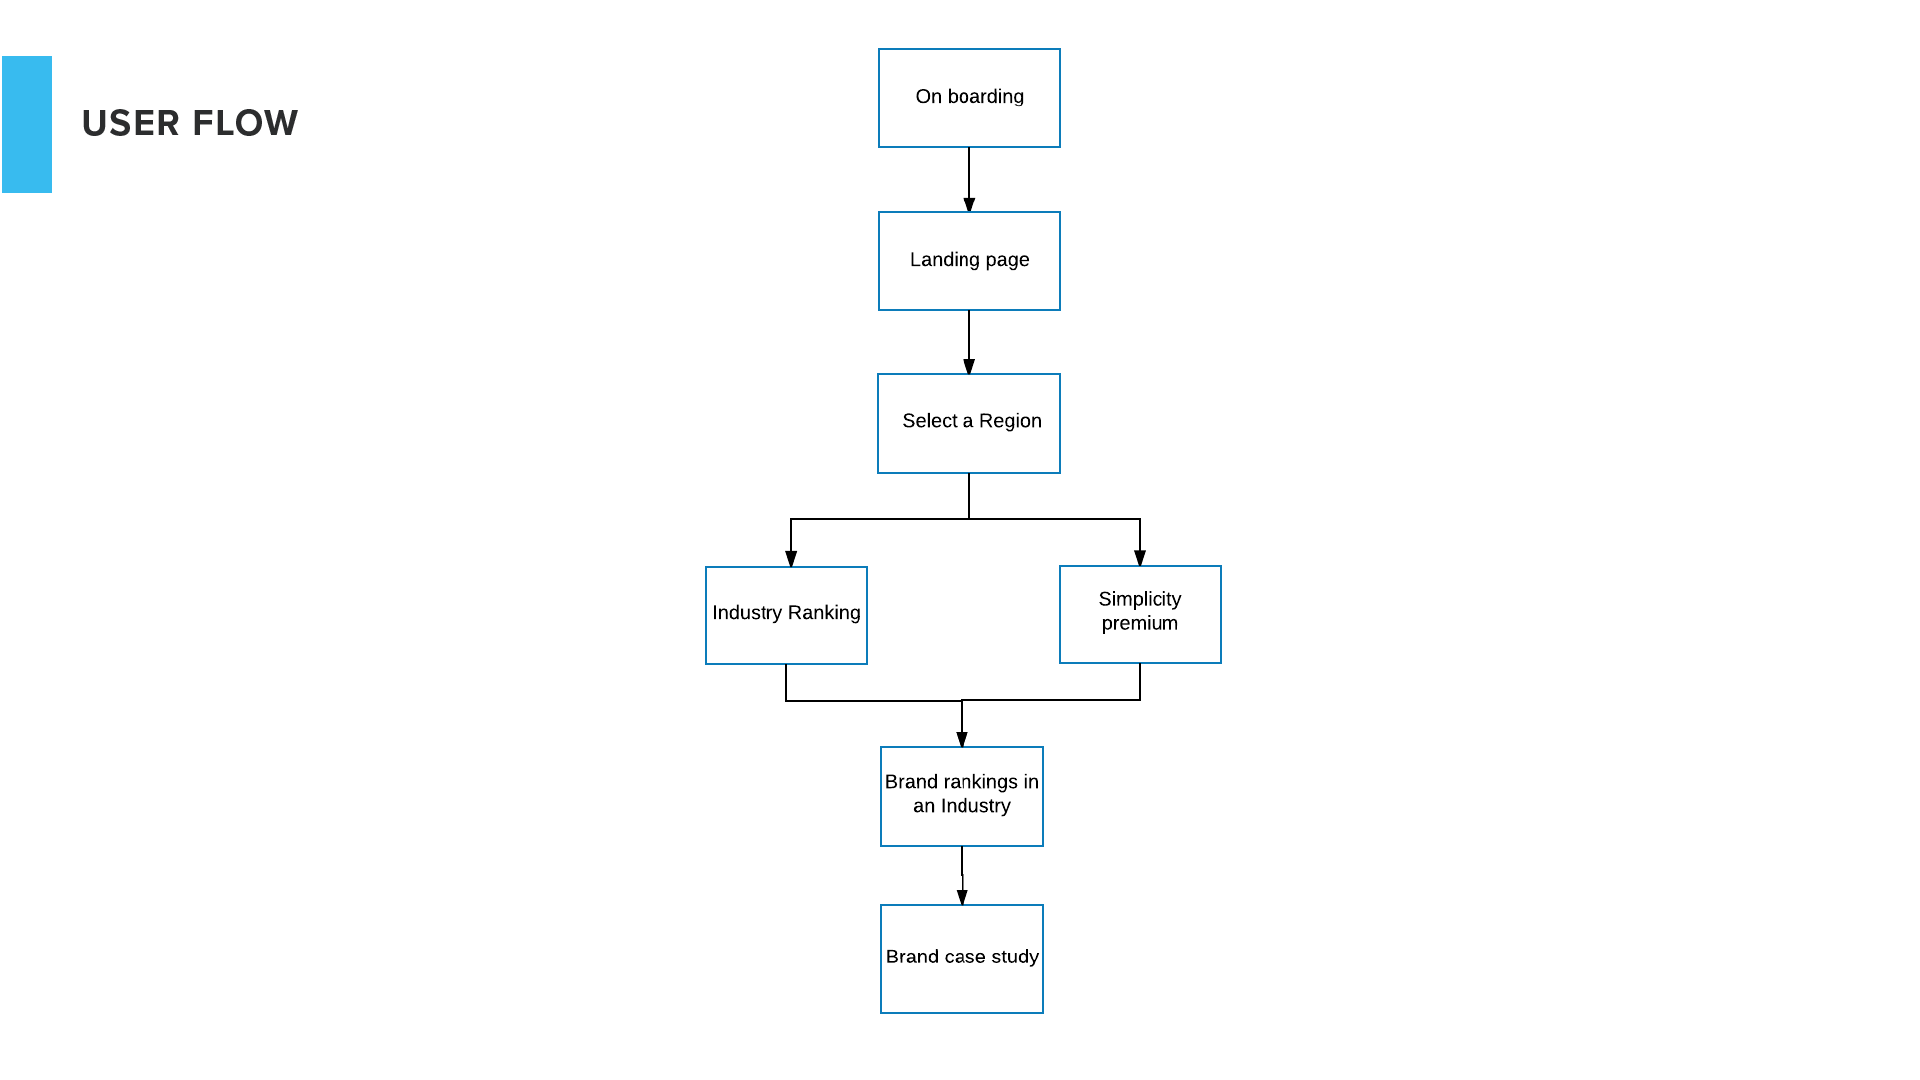
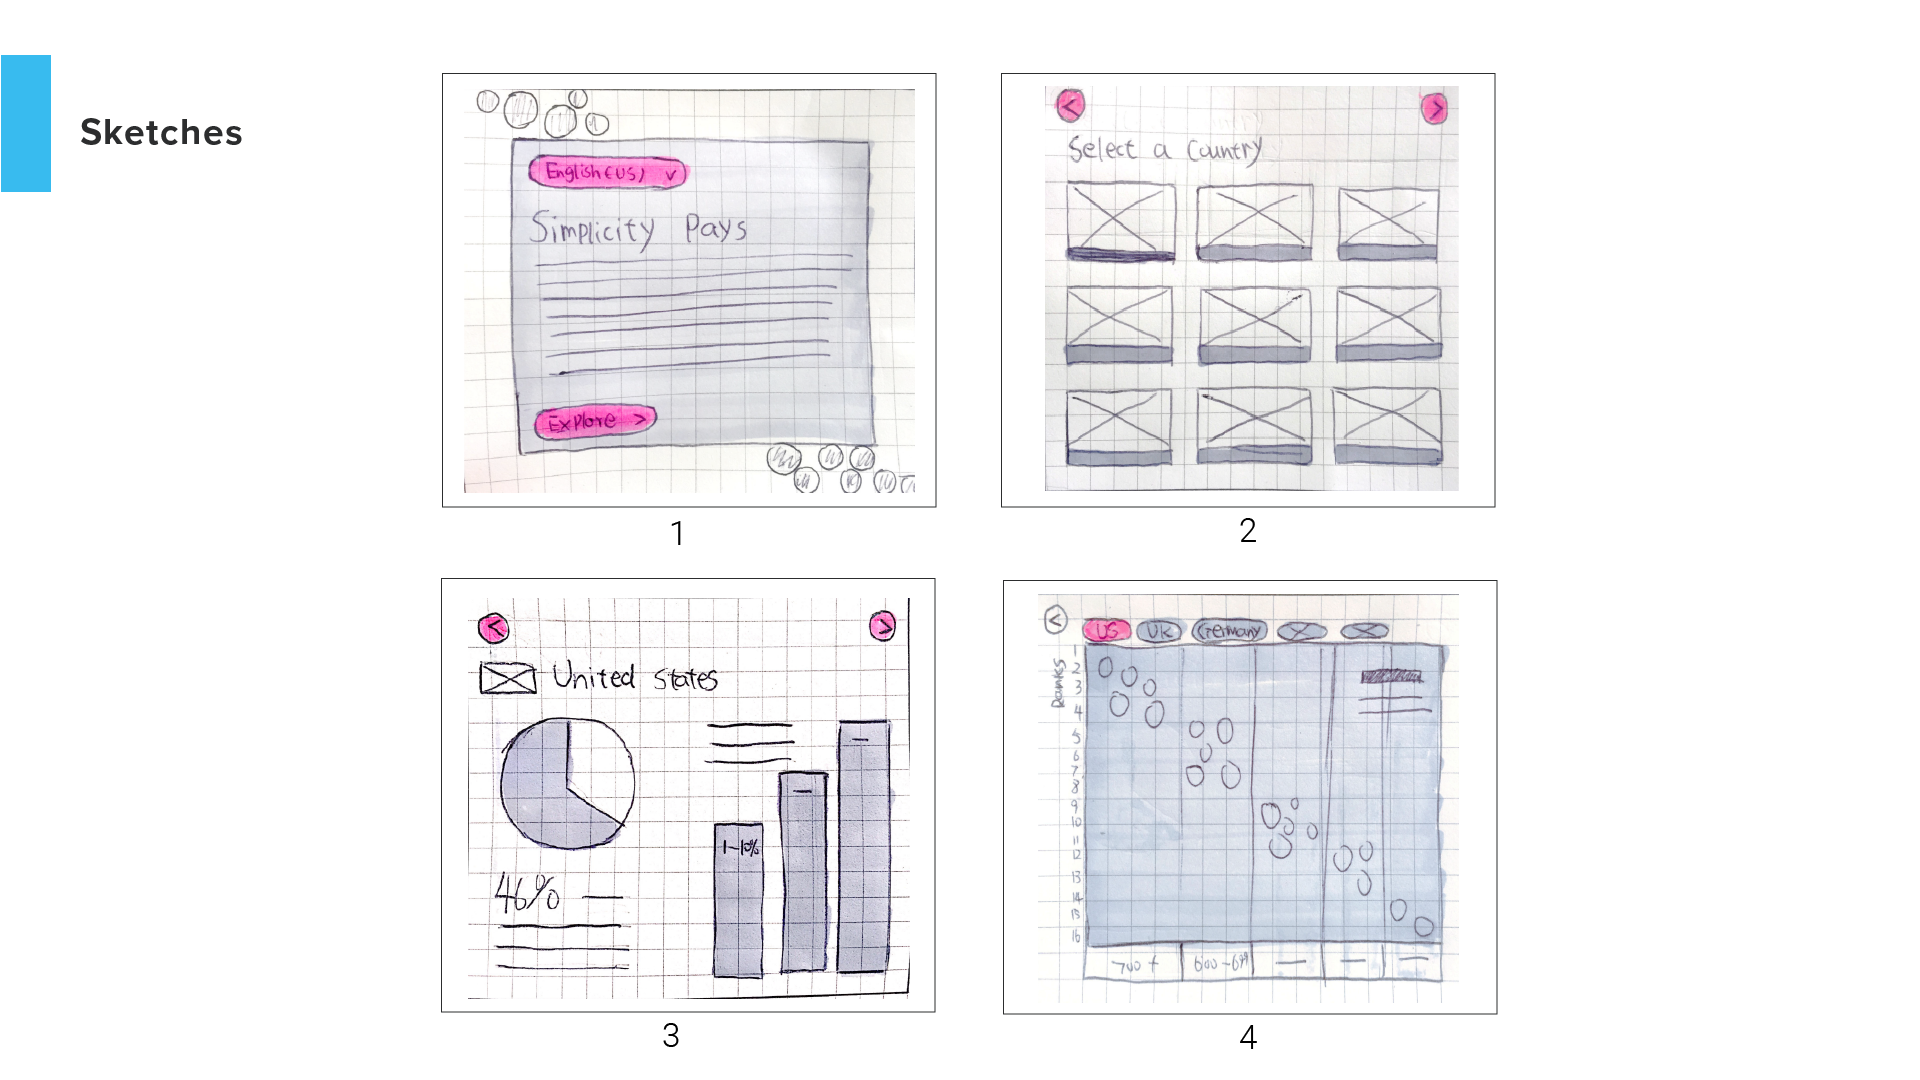
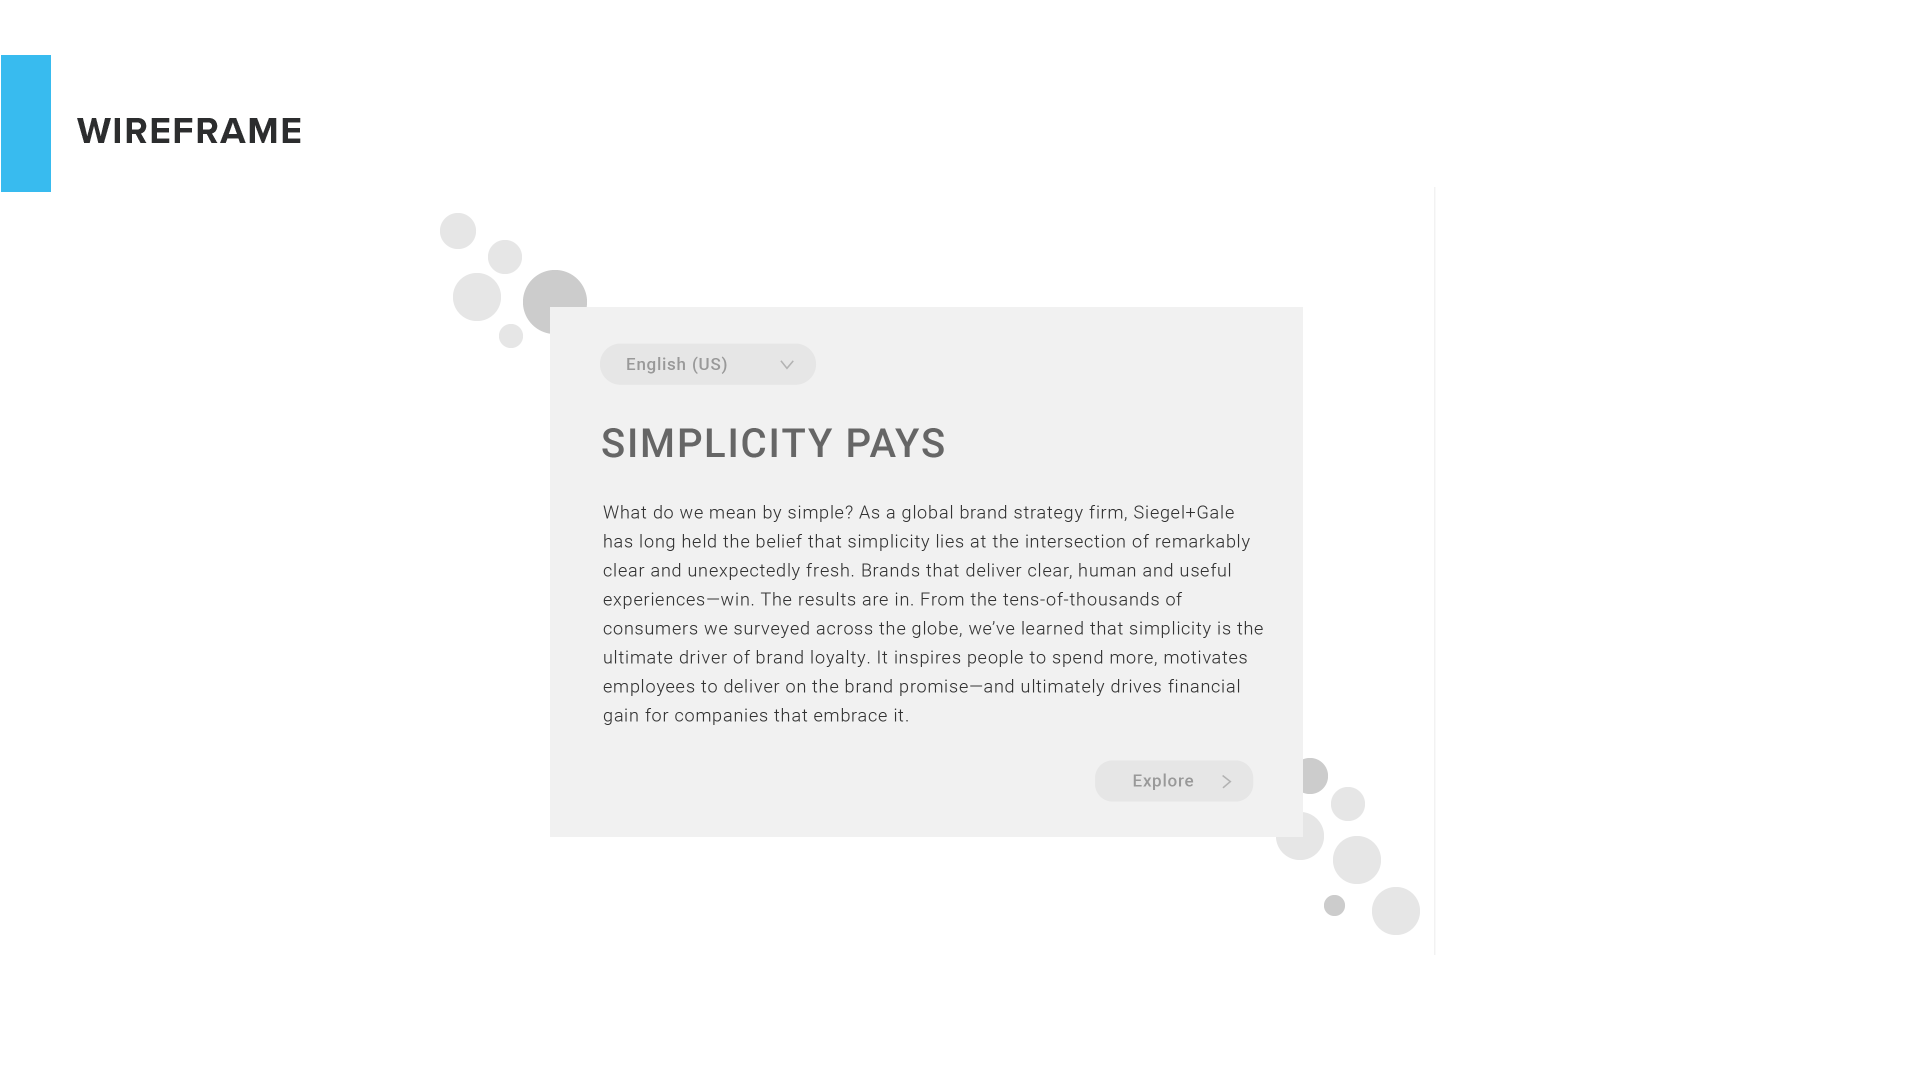
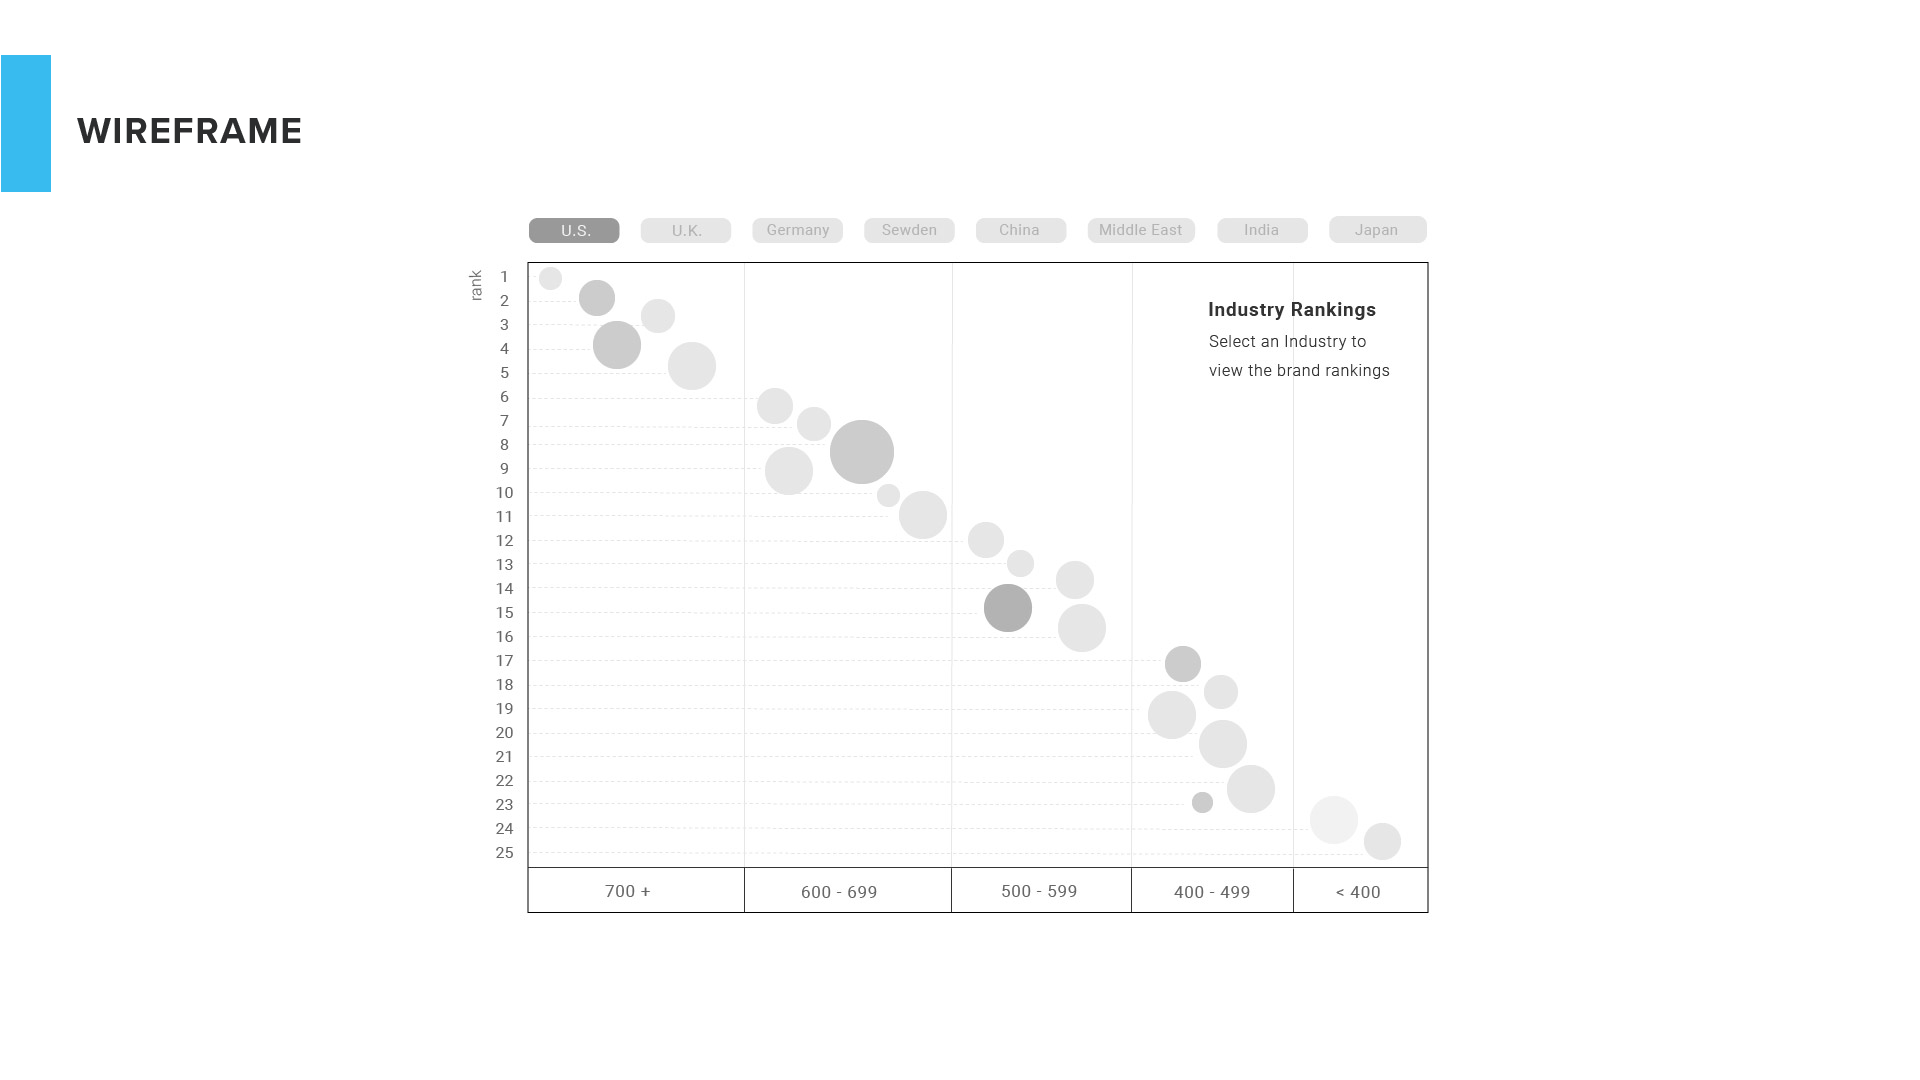
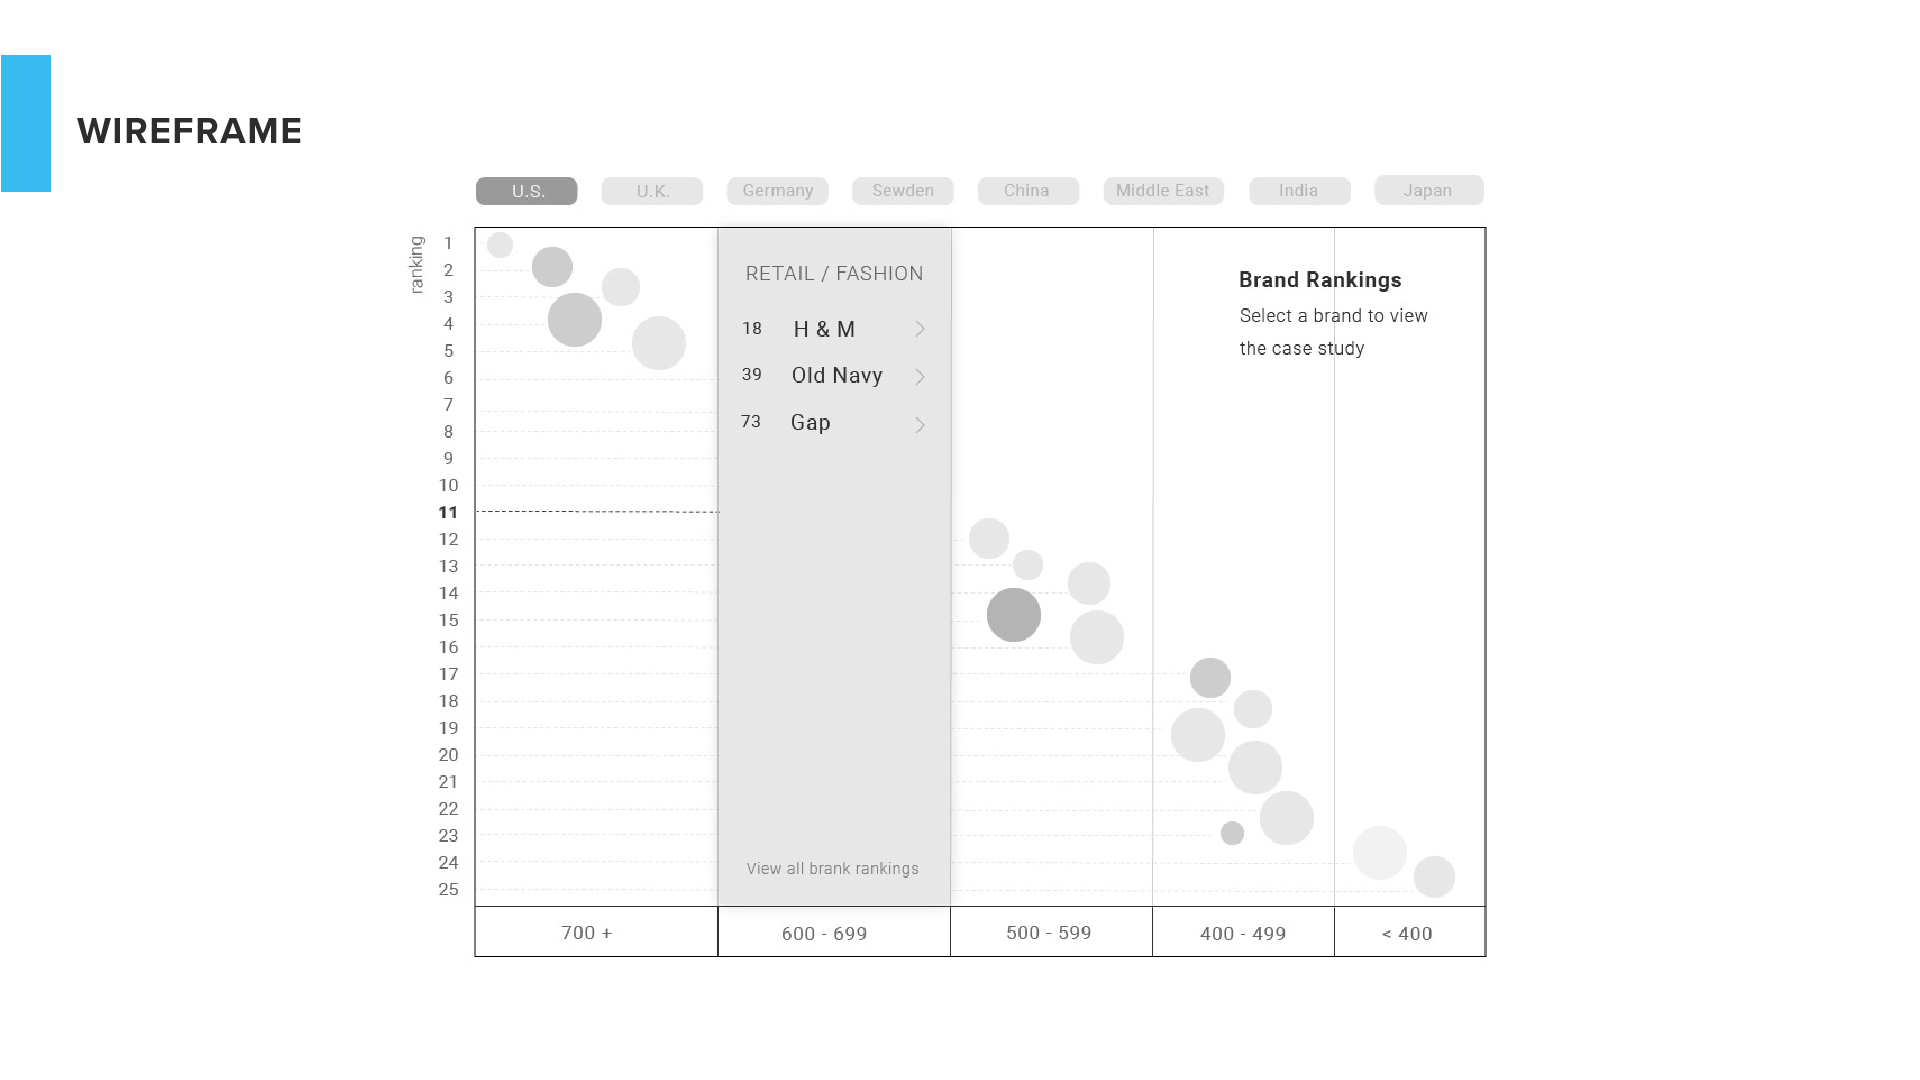
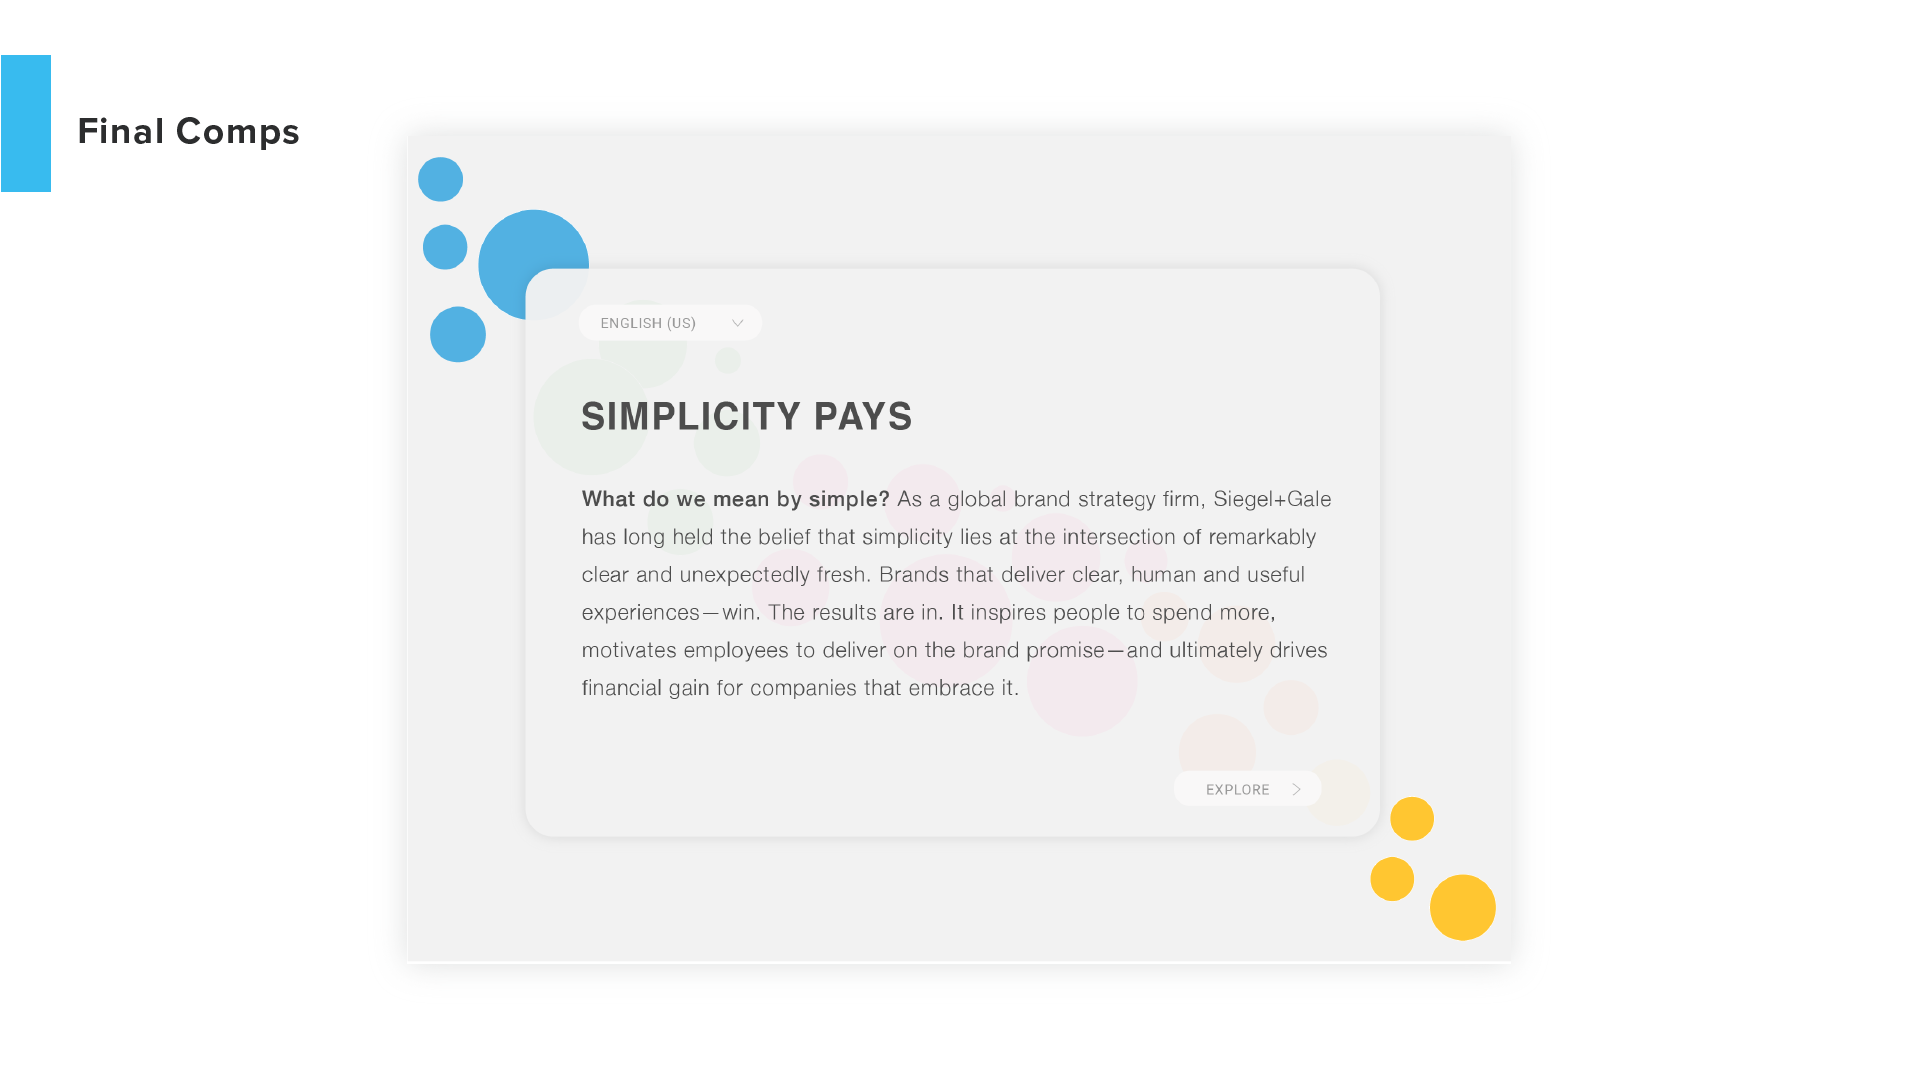
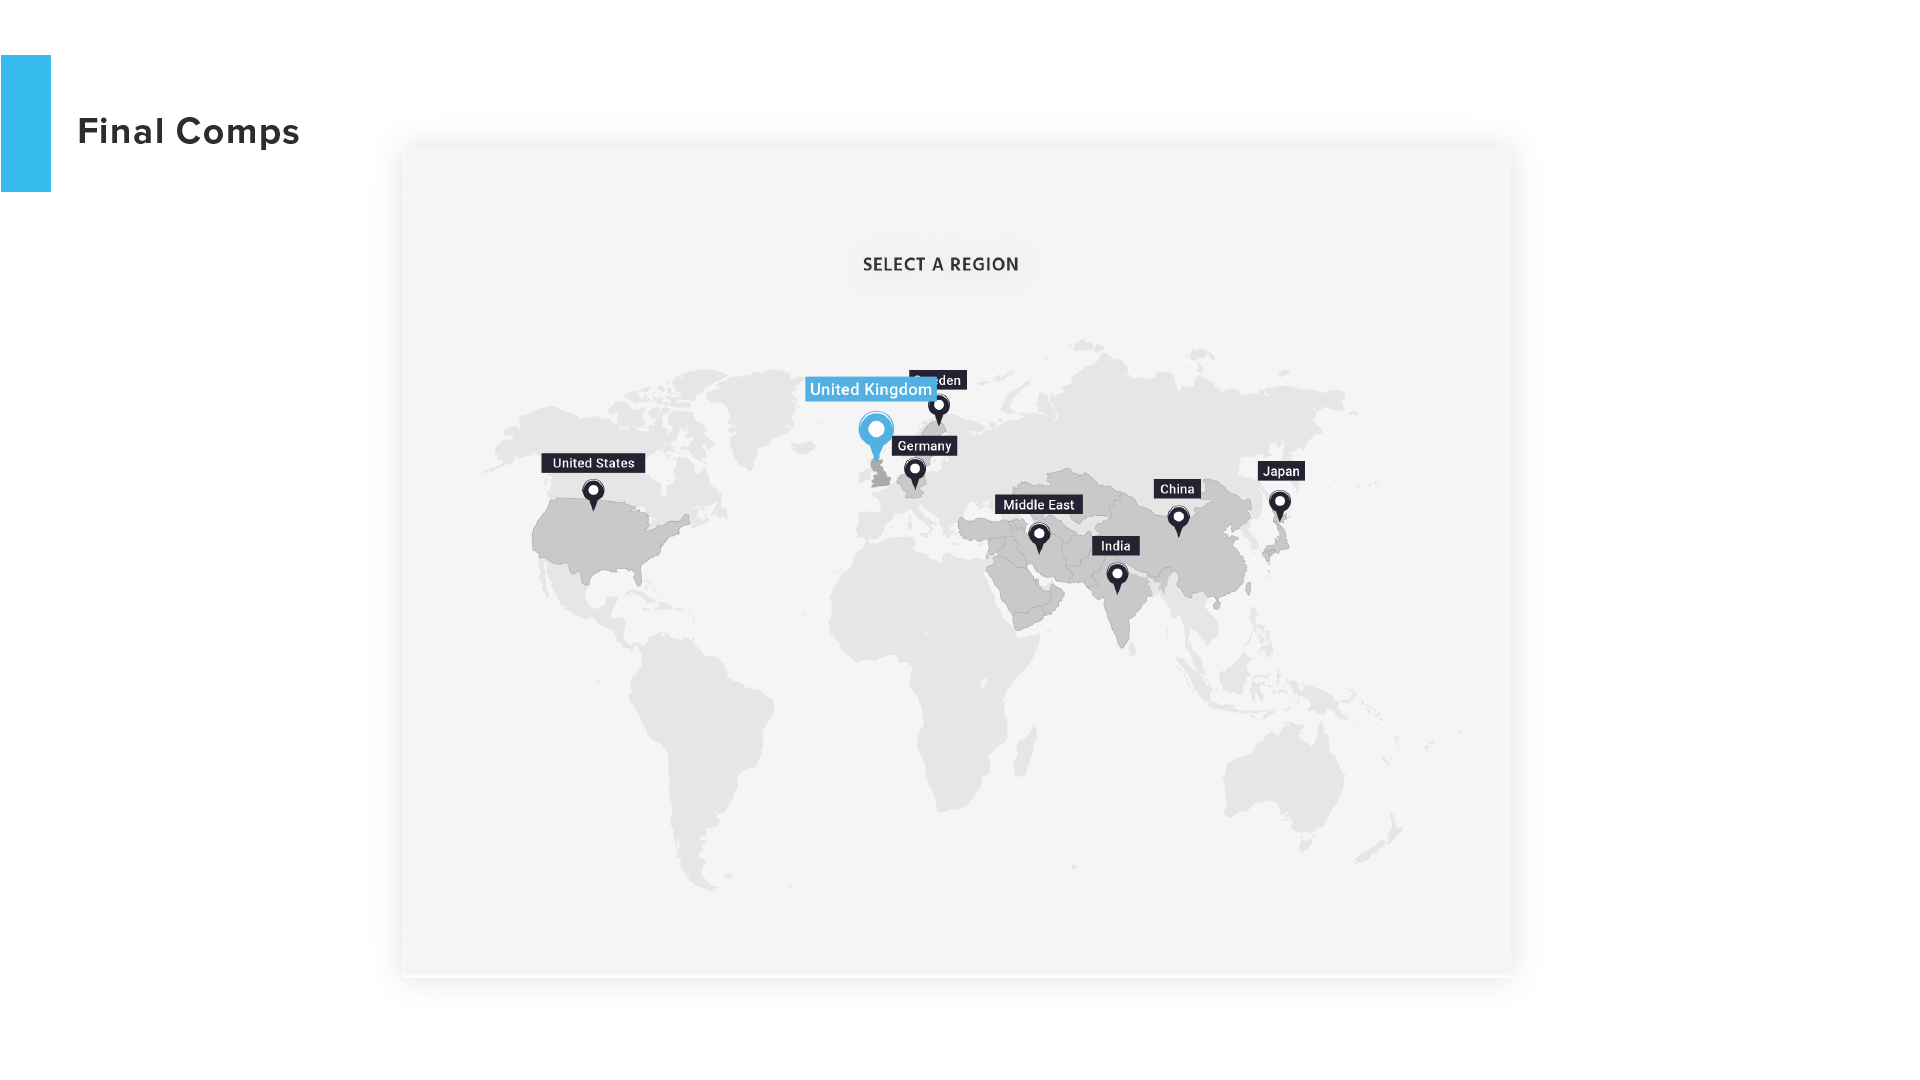
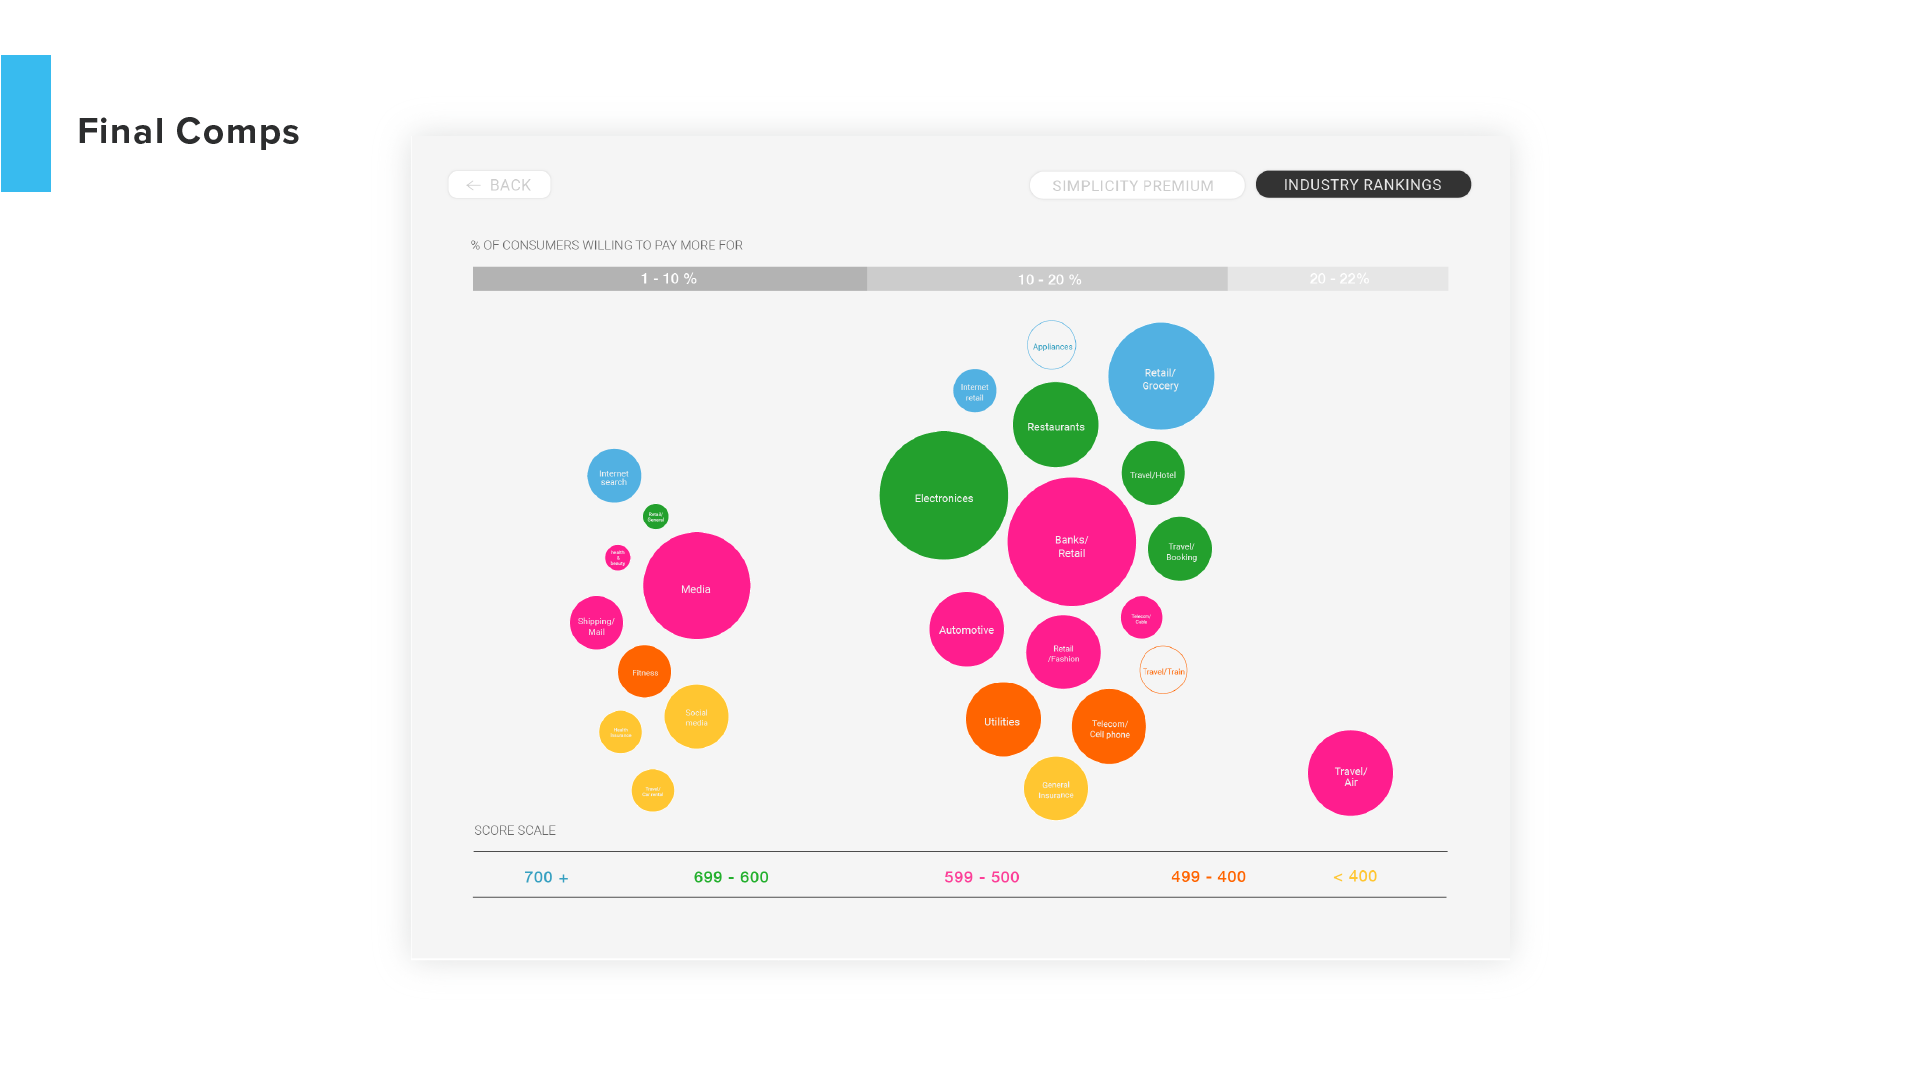
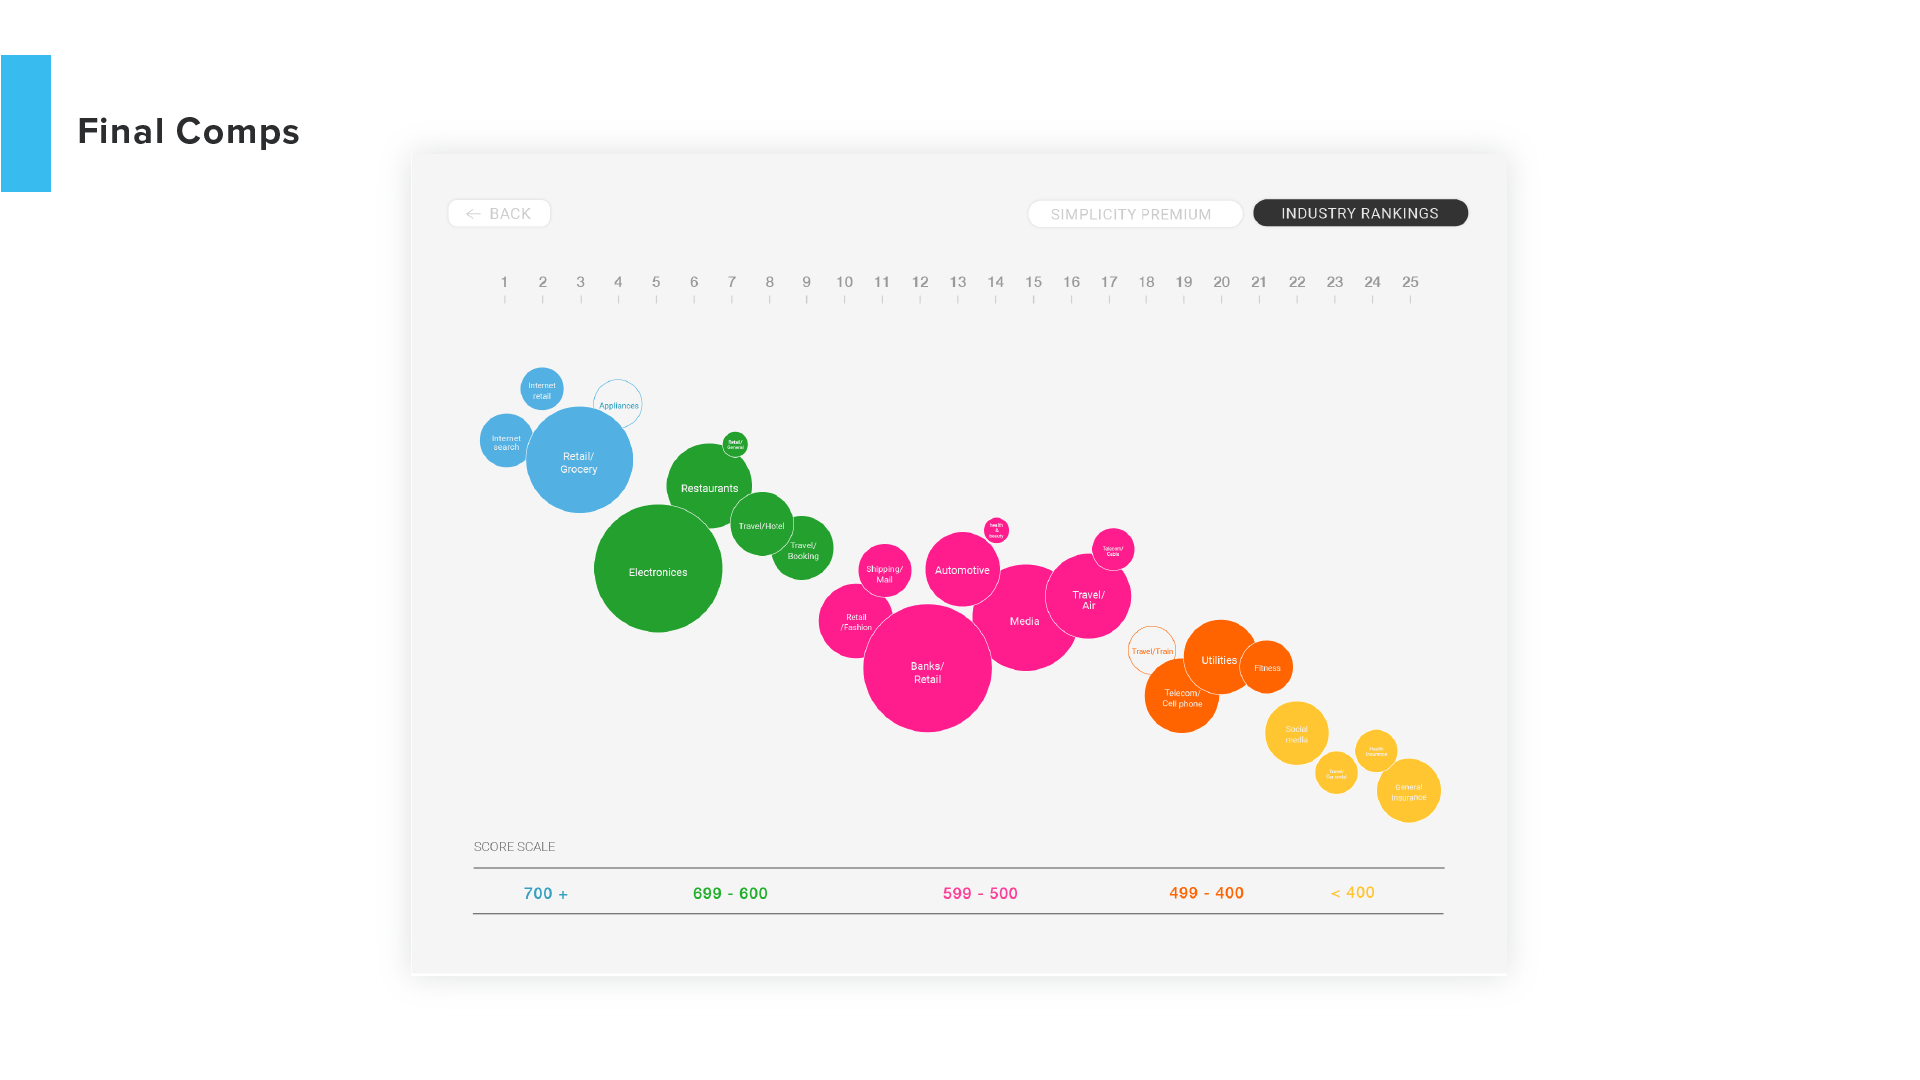
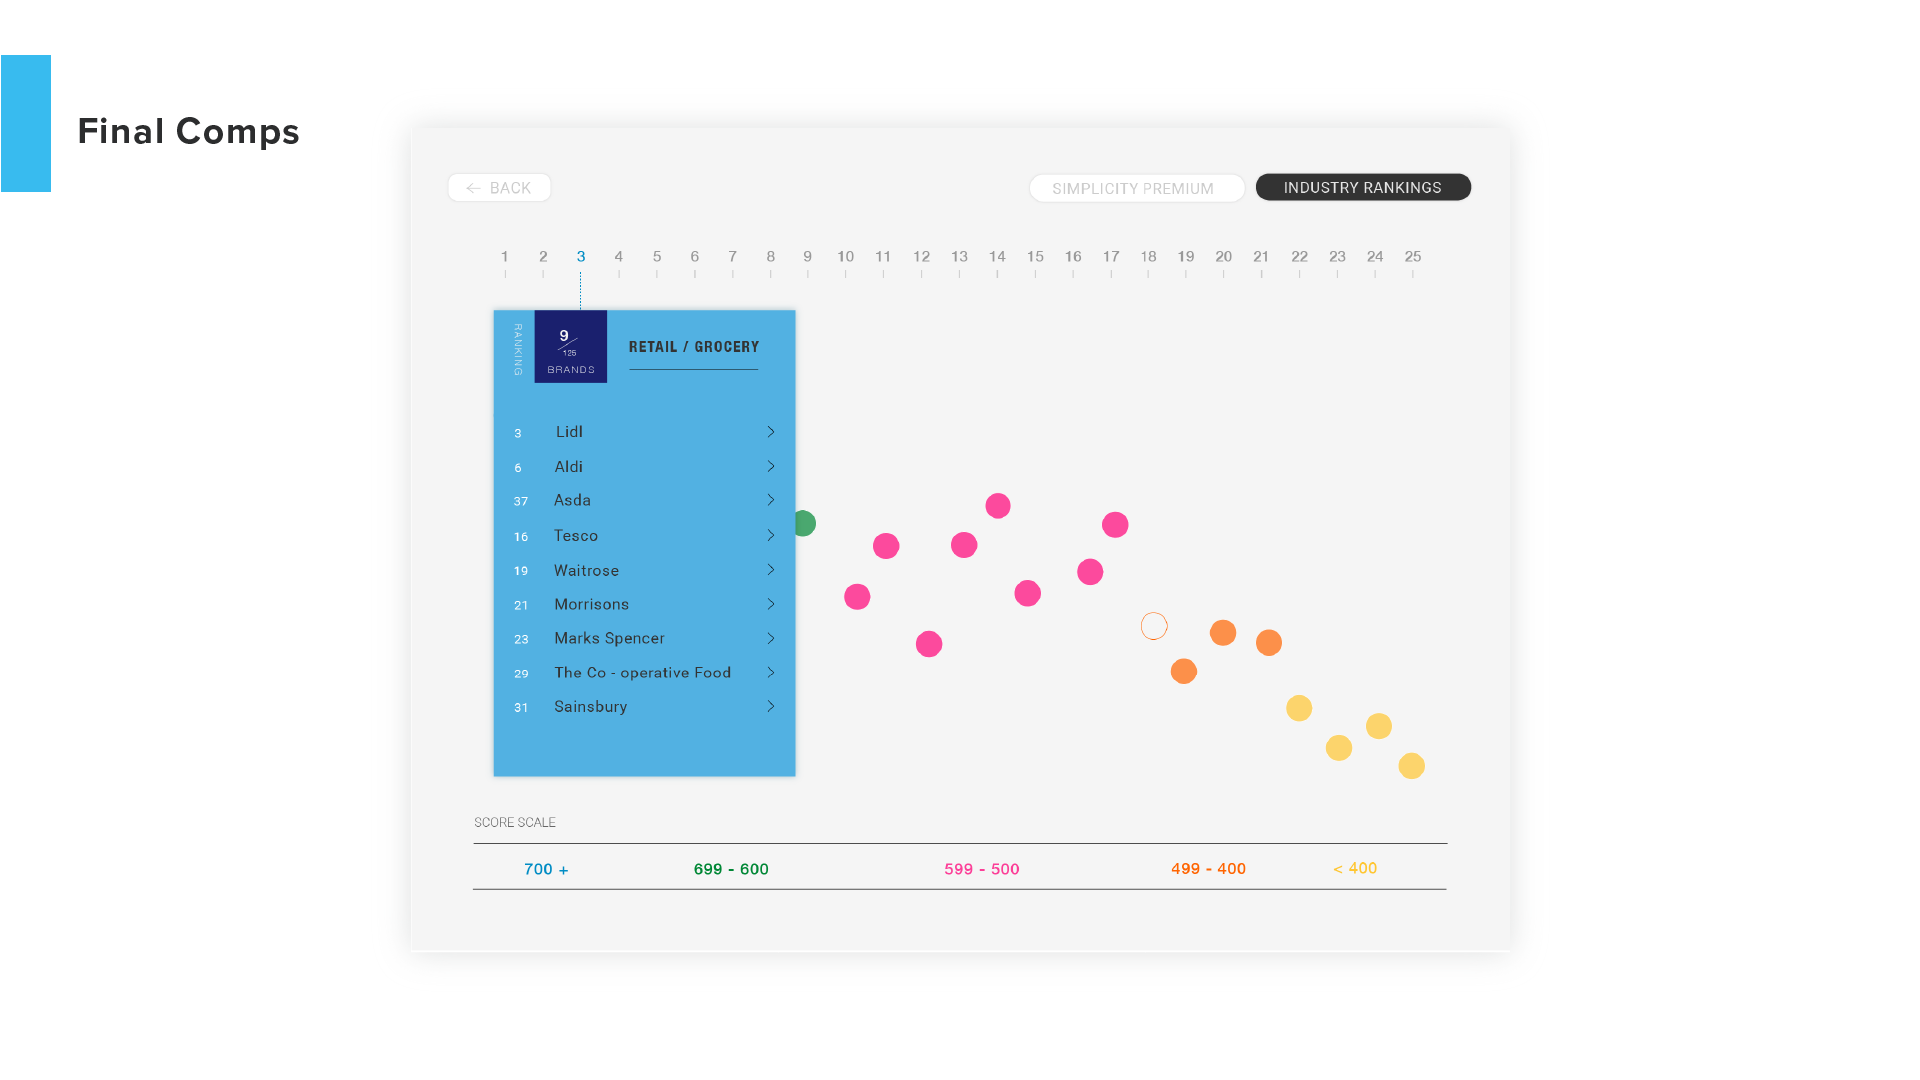
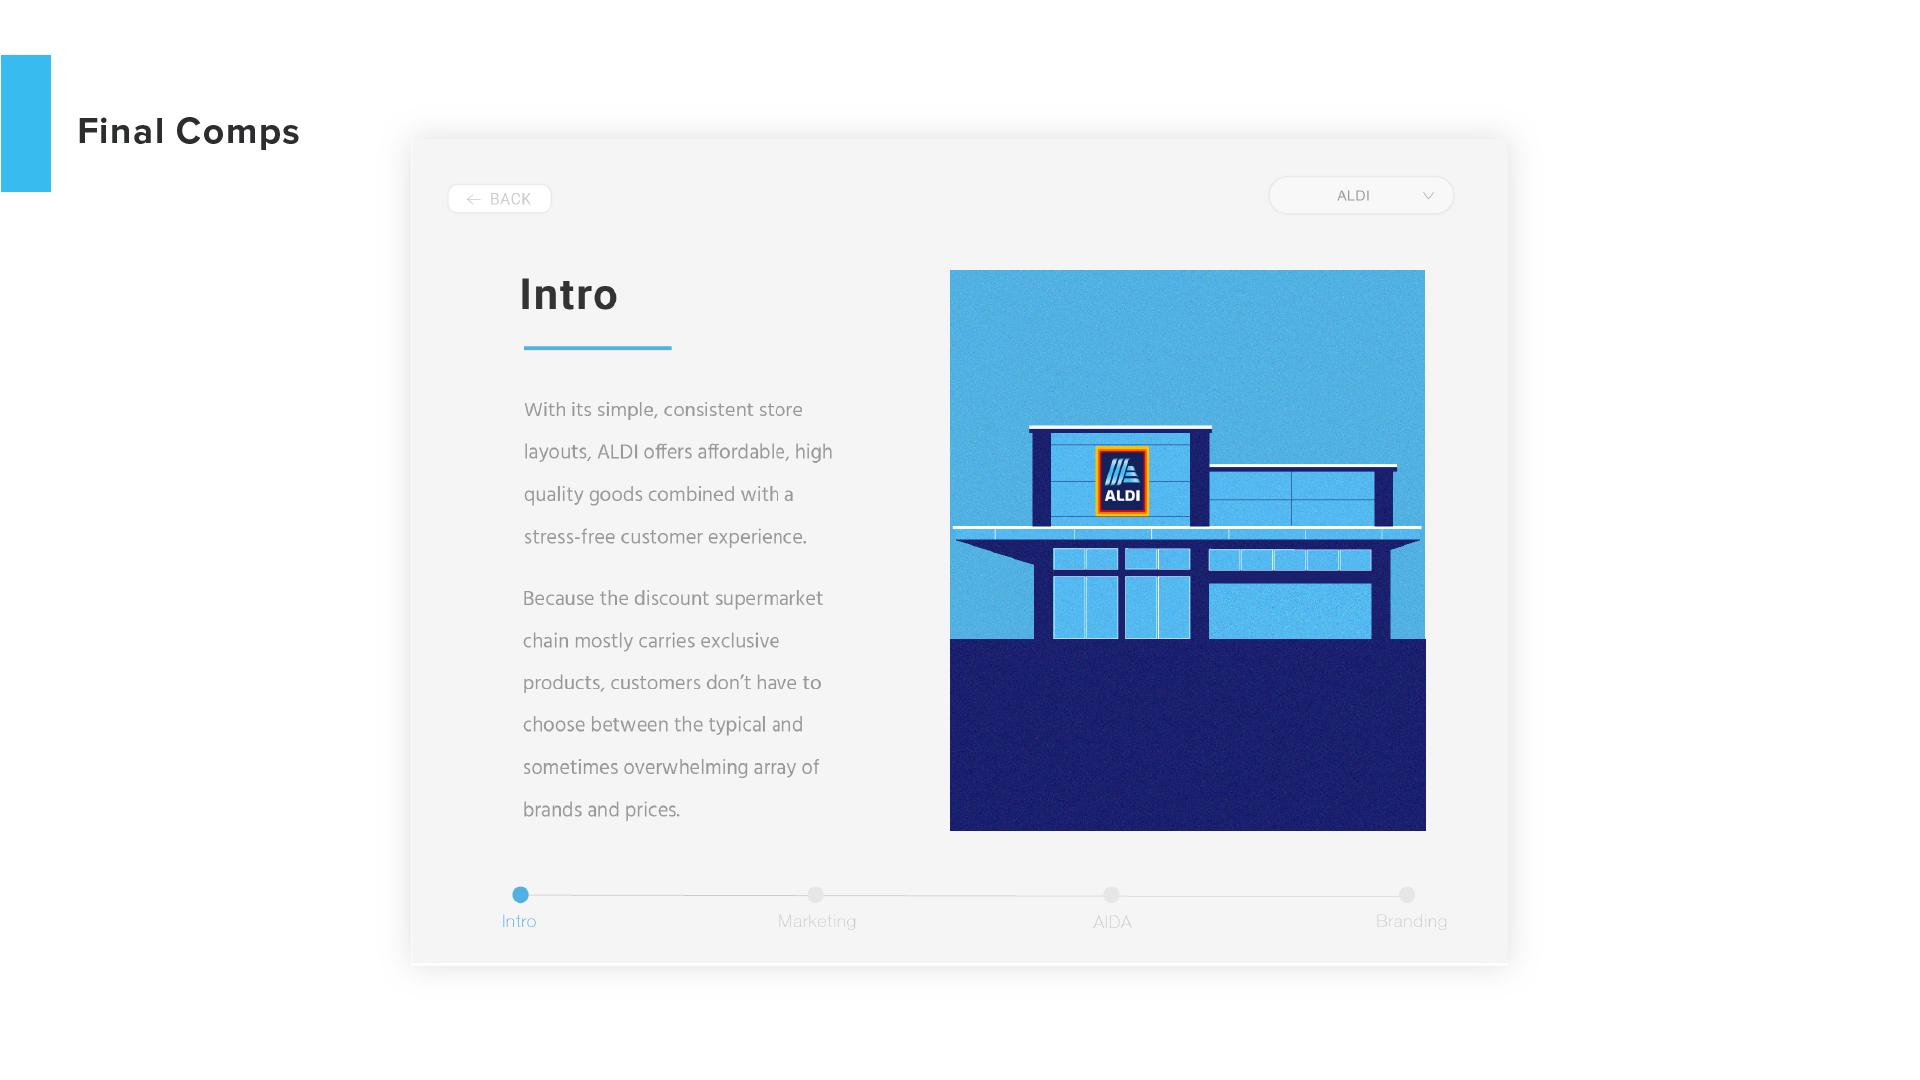
Using data provided by Siegal + Gale, I create this interactive visualization to show how simplicity affects the world's leading brands. According to research conducted by Siegal + Gale, 64% of consumers are willing to pay more for simpler experiences. 61% of people are more likely to recommend a brand due to the simpler experience and communications it provides. Providing facts about Industry Rankings, Brand Ranking, and Brand Case Studies, this web interactive infographic aims to help users to realize their full potential by unlocking the power of simplicity.
Using data provided by Siegal + Gale, I create this interactive visualization to show how simplicity affects the world's leading brands. According to research conducted by Siegal + Gale, 64% of consumers are willing to pay more for simpler experiences. 61% of people are more likely to recommend a brand due to the simpler experience and communications it provides. Providing facts about Industry Rankings, Brand Ranking, and Brand Case Studies, this web interactive infographic aims to help users to realize their full potential by unlocking the power of simplicity.
